


 Aug 8, 2026
 Every government website performance report includes visit counts, session data, and transaction completion rates. But there’s one number that never appears in any report: the users who opened the website, found it too difficult to use, and left silently; no complaint filed, no trace left behind.
That number – the silent loss – is what this article attempts to estimate with real data. Not theory: a calculation built on documented statistics you can apply to your own website.
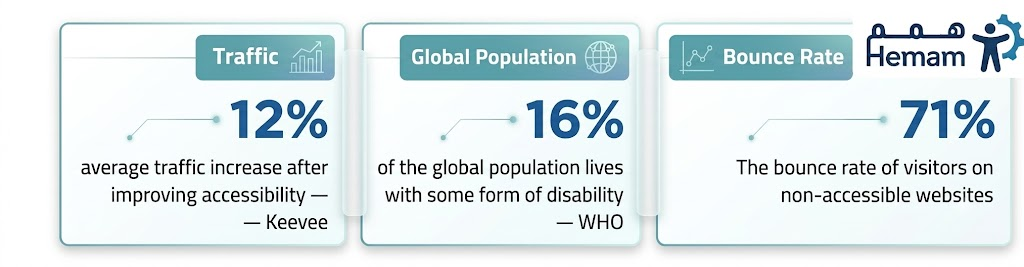
Sources: Click-Away Pound Survey · World Health Organization 2025 · Keevee, 2025
The Formula – Three Numbers That Reveal the Loss
The calculation requires only three inputs: your website’s monthly visits, the share of visitors with disabilities, and the abandonment rate caused by accessibility barriers. These aren’t estimates, they’re documented ratios from international research.
| 🔢 Monthly Loss Calculation Model |
| Total monthly visits (example): 500,000 visits |
| Share of visitors with disabilities (WHO): × 16% = 80,000 visitors |
| Abandonment rate due to accessibility barriers: × 71% = 56,800 visits |
| Estimated monthly loss: 56,800 lost visits |
A website receiving 500,000 monthly visits is losing approximately 56,800 visits every month – more than 680,000 visits per year – due to accessibility issues alone. For a government website, each lost visit translates directly: a transaction not completed, a citizen forced to visit a physical branch, or a request left pending for no visible reason.
For Government Websites, the Loss Isn’t Only About Numbers
In the commercial sector, the loss is measured in missed sales. In the government sector, the equation is different, but no less significant:
| What does a lost visit mean in the context of government services? |
| 🏛 A transaction not completed digitally = a citizen forced to visit a physical branch, despite all digital transformation investment. |
| 📊 Digital service completion rate drops = government performance evaluations are directly affected. |
| 🔁 Additional burden on front-line staff = the resources digital transformation freed up are consumed again. |
| 💔 A frustrated citizen who didn’t complain = the worst kind of feedback, because it’s never recorded and never addressed. |
Accessible vs. Inaccessible – The Numbers Side by Side
A direct comparison between accessible websites and inaccessible ones, based on documented international research and surveys:
| Indicator | Inaccessible website | Accessible website |
| Abandonment rate (users with disabilities) | 71% | Below 20% |
| Transaction completion rate | Noticeably lower | Up to 30% higher |
| ROI on accessibility investment | — | $100 per $1 invested |
| Overall traffic | Baseline | 12% higher on average |
| Return visit likelihood | 61% won’t return | Significantly higher loyalty |
Sources: Click-Away Pound Survey · Forrester Research, 2024 · Keevee, 2025
Why This Loss Doesn’t Appear in Your Reports
“The visitor who left silently is more dangerous than the one who complained – because the first one never gives you a chance to correct anything.”
Digital analytics tools (Google Analytics and similar) record the visits that happened, not the visits that should have happened but didn’t. A user who leaves within three seconds appears as a normal “bounce” in your data. There’s no way to know the reason was low color contrast or a button that doesn’t respond to keyboard navigation.
This is what makes the loss “invisible” in most reports, meaning it goes unaddressed and accumulates month after month.
Calculate Your Own Number
The formula is straightforward and applicable to any website:
| 📐 The Formula – Apply It to Your Website |
| Step 1: Find your monthly visit count from Google Analytics or your monitoring tool. |
| Step 2: Multiply by 16% (the share of users with disabilities, per WHO). |
| Step 3: Multiply the result by 71% (the abandonment rate from inaccessible websites). |
| Result = estimated monthly visit loss from accessibility barriers. |
| Example: 200,000 visits × 16% × 71% = 22,720 lost visits per month. |
The Bottom Line: Numbers Clarify the Truth
This calculation isn’t about blame, it’s about understanding the real size of the opportunity. Every visit lost to an accessibility issue is a visit recoverable through specific design decisions and available tools. The government entity that moves today isn’t just correcting a mistake; it’s reclaiming its visitors, improving its performance indicators, and completing the digital transformation promise it already made.
The loss doesn’t show up in reports, because the visitor who left left no trace.
But it’s real, calculable, and recoverable.
Find out how to reclaim those visits at hemam.io